Warning:
I am not a mathematician.
(But you probably are.)
Let's start with a story.
A story about somebody else.

David Beazley
- PhD. in Computer Science
- Author of the Python Essential Reference
- Keynote speaker
- Teaches his kids to play with high speed cutting tools.

Travis Oliphant
- PhD. from Mayo Clinic
- Author of NumPy, founding contributor of SciPy
- CEO of Continuum Analytics
- Has six kids and "a very patient wife"
 1 import requests
 2 import webbrowser
 3 from bs4 import BeautifulSoup
 4 from time import sleep
 5
 6 daves_lat = 41.980262
 7 daves_lon = -87.668452
 8 required_distance = 0.5/69
 9
10 while True:
11   r = requests.get('http://ctabustracker.   com/bustime/map/getBusesForRoute.jsp?route=22')
12   if r.status_code > 200:
13      raise AssertionError
14   doc = BeautifulSoup(r.text, "html5lib")
15   buses = doc.findAll('bus')
16   params = []
17   markers = []
18   done_looking = False
19   for bus in buses:
20     if bus.find('d').string.startswith('North'):
21       bus_id = bus.find('id').string
22       lat = float(bus.find('lat').string)
23       lon = float(bus.find('lon').string)
24       distance = abs(lat - daves_lat) * 69
25       print "[bus %s] lat: %f, lon: %f, distance: %f miles" % (bus_id,  lat, lon, distance)
26       if distance <= 0.75:
27         params.append("markers=color:red|%s,%s" % (lat, lon))
28         done_looking = True
29   if done_looking:
30     params.append("markers=color:blue|%s,%s" % (daves_lat, daves_lon))
31     params.append("size=800x600")
32     params.append("sensor=false")
33     params.append("center=%f,%f" % (daves_lat, daves_lon))
34     params.append("zoom=14")
35     params.append("key=AIzaSyBvWkP7S_qVZzh6E7OCTekHmT1NM-_0voc")
36     url = '<. href="http://maps.googleapis.com/maps/api/staticmap?%s">http://maps.googleapis.com/maps/api/staticmap?%s' % "&".join(params)
37     webbrowser.open(url, autoraise=True)
38     break
39   else:
40     sleep(10)
41
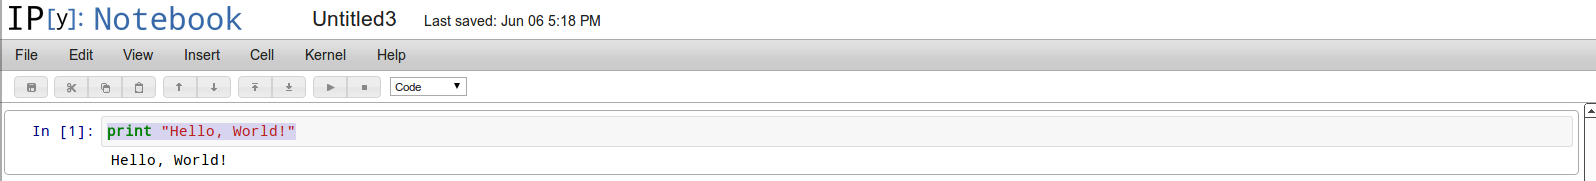
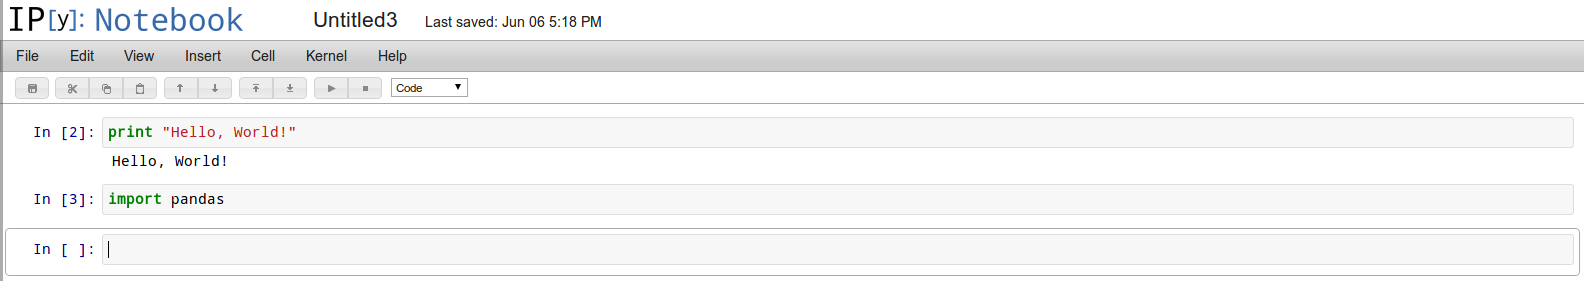
Navigating IPython
Using Pandas
Pandas Series
  ds1 = pandas.Series(range(10))
  ds2 = pandas.Series(list('MilwaukeeData'))
  ds3 = pandas.Series(np.random.random_integers(0,100,10))
  ds4 = pandas.Series(np.random.choice(list('AEIOU'), 10))
Pandas Data Frames
  df1 = pandas.DataFrame(
      np.random.rand(10,4),
      index=range(10),
      columns=list('ABCD'))
  df2 = pandas.DataFrame(
      np.random.randn(10,4),
      index=list('abcdefghij'),
      columns=list('ABCD')) # randn is standard normal distribution
  df3 = pandas.DataFrame({
      'A': list('ABCDEFGHIJ'),
      'B': np.random.choice(list('ABCDEFGHIJ'),10),
      'C': range(10)})
Viewing Pandas Data
  df1.head()
  df2.tail(3)
  df2.index
  df3.columns
  df2.values
  df2.sort_index(axis=0, ascending=False)
  df2.sort_index(axis=1, ascending=False)
  df1.sort(columns='A')
  df1.describe()
Selecting Pandas Data
  df1['A'] # column A
  df3.loc[0] # row 0, where index is 0 - 9
  df3.loc[0:3] # the first four rows, where index is 0 - 9
  df2.loc['a'] # row 'a', where index is 'a' - 'j'
  df2.loc['a':'d'] # the first four rows, where index is 'a' - 'j'
  df2.iloc[3] # the third row
  df2.loc['a':'c', ['A', 'C']] # columns A and C for the first three rows
  df2.iloc[0:2, 0:2] # the first two rows and columns
  df2.at['a','A'] # the single value at row 'a' column 'A'
  df2.iat[0,0] # the single value in the first row and first column
  df1.ix[1:3,0:2] # The second and third row, first and second column
  df2.ix[1:3,0:2] # The second and third row, first and second column
Selecting Data Conditionally
  df1[df1['A'] > 0.5]
  df2[df2 > 0]
  df3[df3['B'] < 'h']
Assigning Values
  df3.at[9,'C'] = 10
  df3['d'] = pandas.Series([9,8,7,6,5,4,3,2,1], index=range(10))
  df2.iat[0,0] = 0
  df2 = -df2
  df4 = df2.copy()
  df4[df4 > 0] = -df4
Some statistics
  df1.min()
  df1.min(1) # other axis
  df1.max()
  df1.max(1) # other axis
  df1.mean()
  df1.mean(1) # other axis
  df1.median()
  df3['b'].value_counts()
  df3['b'].rank()
  df1.std()
  df1.quantile()
Interesting data sets?
- Milwaukee County Transit stops and times
- The address of every parking spot in Milwaukee
- The location of every pothole in Chicago
- The location of every drinking fountain in NYC
- A list of every federal goverment agency
Challenge #1
Water data set from https://github.com/milwaukeedata/MilwaukeeWater2011
  dfw = pandas.read_csv(
      'MilwaukeeWater2011/Milwaukee-2011-07-14.csv',
      index_col=False, parse_dates=[4,5])
  dfw.iloc[0]
Some challenges:
- Easy: Total Milwaukee water use
- Easy: Average water use
- Medium: Address with most water use
- Hard: Average water use per day
Challenge #2
Parking tickets from https://github.com/
milwaukeedata/MKE_2012_Parking_Violations
  dft = pandas.read_csv(
      'MKE_2012_Parking_Violations/2012_MKE_tickets_issued.csv',
      parse_dates=[1], index_col=1)
  dft.iloc[0]
Some challenges:
- Easy: Most ticketed offenses
- Easy: Most ticketed addresses
- Hard: Worst time of day