In February 2013 I heard about the MKE Event for the International Open Data Hackathon[1]. Since it had the word "hackathon" in the title, I thought I'd attend. I didn't know any more than that. It was awesome - here were a group of people, none of whom I already knew, who were part of the Milwaukee Data Initiative[2]. They work to get Milwaukee to open up its critical data to citizen hackers who will build applications that make that data useful to the people of Milwaukee. I worked on a team that scraped the night parking regulations and built an interactive, zoomable map of Milwaukee that tells you the night parking regulations for any address, simply by clicking on the map.
The next month I attended PyCon 2013[3] in Santa Clara, California, and through a series of mishaps ended up in a tutorial called "Learn Python Through Public Data Hacking", led by David Beazley.[4] He started off with a warning that "Learn Python" was the important part of the tutorial title, and that it wasn't a tutorial on hacking public data. I was disappointed, since I felt like I already knew Python pretty well and looked forward to pursuing my new-found interest in civic data hacking. I was in for a surprise. Not only did I learn a ton about civic data hacking in the next 3 hours and 20 minutes, but he absolutely kicked my butt with Python, too.
I started attending the Milwaukee Data Initiative meetups regularly, and I got a brief opportunity to demonstrate some of the code I wrote in David's tutorial. That led to this presentation on exploring data sets from the inside-out using IPython and Pandas. It also led to a conversation with Rafael Santana, a founder of the Milwaukee Tech Engine.[^techengine] Ultimately I presented at a joint meetup for members of the Milwaukee Data Initiative, Milwaukee Tech Engine, and MKE Python.[5]
This presentation is not about learning Python. In fact, using Python is ancillary to the workshop - only enough Python is demonstrated to work interactively with various data sets. To a limited extent, it is a workshop about using IPython[6], an interactive Python shell that can be run in the browser and supports rich media like charts and graphs. To a greater extent, it's about Pandas,[7] a data analysis library for Python. These two technologies are presented in the context of civic hacking, with a couple of provided data sets and some challenges that participants might solve using these tools.
I write my presentations in advance, and then do my best to present what I wrote, so this post is something close to a transcript of my presentation. Actually, it's a transcript of how I meant to give the presentation, without the 'ums' and 'ahs', nervous pauses, misplaced words, and sections I undoubtedly missed due to my numerous deficiencies in public speaking. My slides are inline below, but check out my slide deck online too. Keep in mind this was a 90 minute hands-on workshop, so the slides and this writeup are not the important part. The important part was the people at their laptops learning by doing.
Hi, I'm version2beta. Some people call me Rob. You can call me either.
This is a civic hacking presentation, and we're going to work with a couple of data sets that might pique your interest. Hopefully, just the nature of the data we've collected will suggest to some questions that you'll want to answer for yourself. Just in case it doesn't, we also have some challenges.
It's not a presentation on learning to program in Python, but we are going to use an interactive Python shell called IPython, and a data analysis library called Pandas. So along the way you'll probably learn at least enough Python to start using these two tools.
As you're working with the data and tools, you might be inclined to use probability and statistics. If you feel so moved, please go right ahead. But I do want to warn you that I'm a programmer, not a mathematician, so my utility in that area will be limited. I do understand however that we have engineers in the house who are probably pretty good at the probability and statistics stuff, and as a group I hope we'll help each other out.
I think it's best to start a presentation off with a story. Often that story offers a little bit about the presenter. I'm going to start with a story, but it'll be only a very little bit about me, and much more about two guys named David Beazley and Travis Oliphant. And also a bus in Chicago.
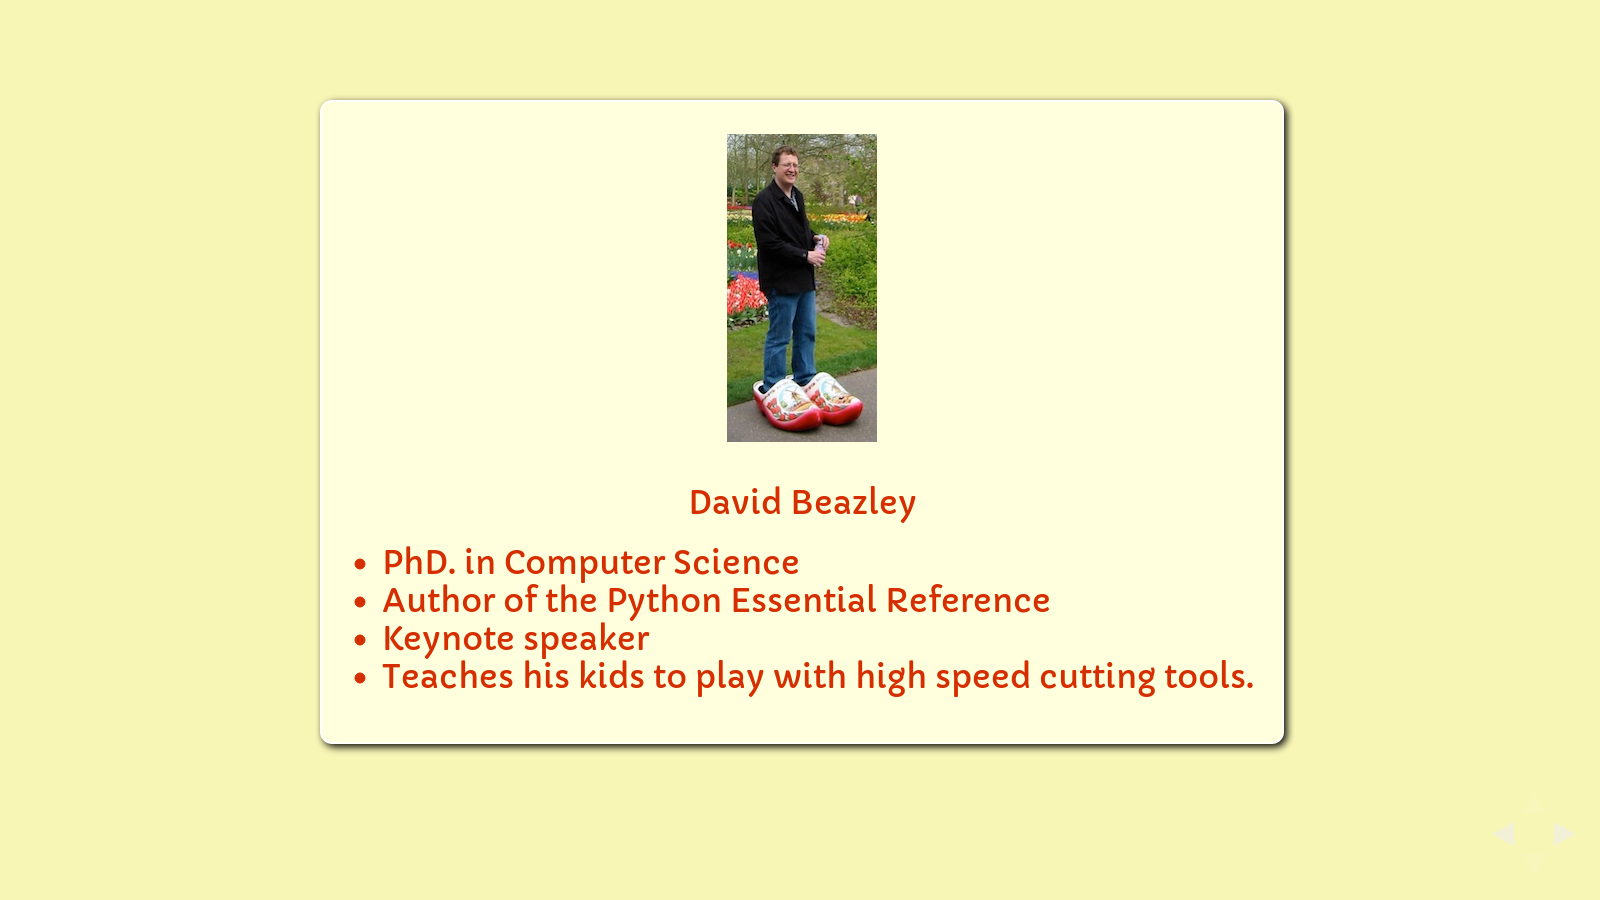
Last March, I went to PyCon, the big conference for people who use and hack on the Python programming language. Through a series of misadventures involving bad network connections and other computing problems, I ended up in a tutorial called "Learning Python Through Public Data Hacking" put on by David Beazley. At the time I didn't know anything about David Beazley, which was clearly a gaping hole in my Python education. Among many other contributions, he wrote the Python Essential Reference, the first and possibly most serious reference book published for Python. It's been called "the best programming book I have ever seen" and "the sweet spot of concise usefulness" by people who like programming books. Other people have said "It makes my eyes hurt" and "This is not a book for learning Python. It's a book for writing Python."
This book is for heavy lifting.
David himself does some pretty heavy lifting, but when he introduced the tutorial, he wanted to make sure we all knew it was much more about "learning Python" and much less about "public data hacking". I was disappointed; I felt like I already knew Python programming pretty well and looked forward to the public hacking part of the presentation. And then, for the next three hours and twenty minutes, David proceeded to kick my ass with both Python and public data hacking. I think I crawled out of the room at the end.
He prepared three challenges for us. The first one came from his own experience, and involved Travis Oliphant.
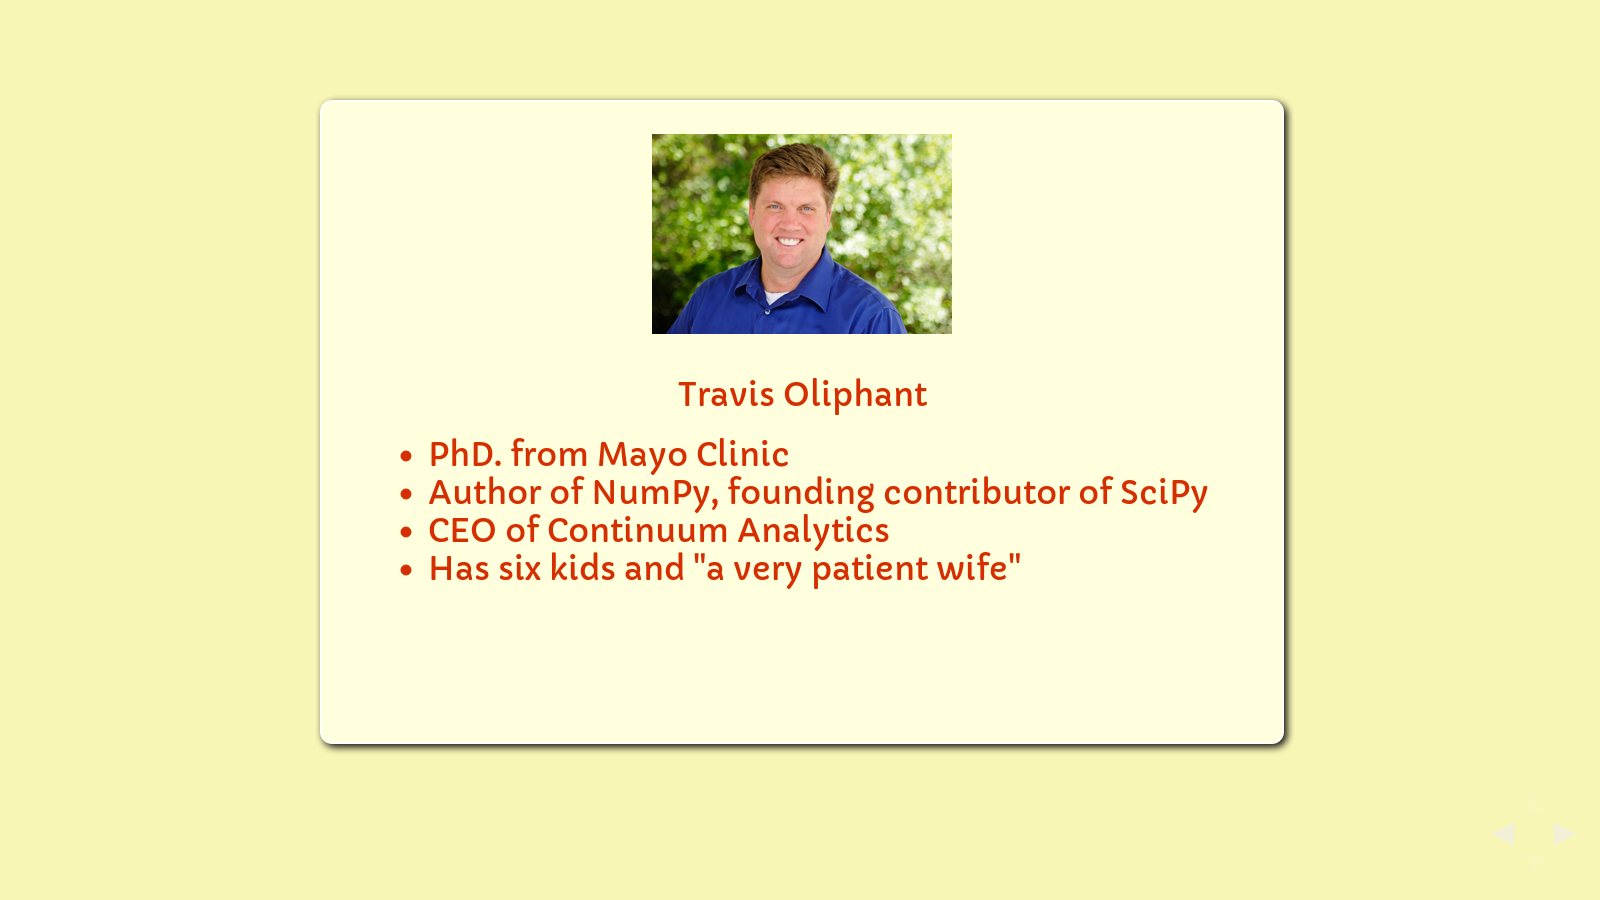
Travis Oliphant is a little bit indescribable.
I interviewed for a job with Google not too long ago, and the interviewer asked me to rate my skills on a scale of 1 to 10. She anticipated my question on what kind of scale Google uses when it comes to rating your skills, since they have some of the best programmers in the world working there. She described how a three or four indicated the kind of competence where you could use a skill independently, and a six or seven is "expert". You don't get to a ten unless you not only created the technology, but it was probably your PhD. dissertation.
Travis Oliphant is a ten. He has degrees in Mathematics and Electrical Engineering, got his PhD. at the Mayo Clinic, and taught at Bringham Young University for seven years. He's the author and primary developer of the NumPy library for numerical analysis, and a founding contributor to the SciPy library for scientific computing. Right now he's CEO of Continuum Analytics, a company that makes the kind of Python tools I use in my dreams where I think I'm a genius and everyone needs me to save the world.
David told a story about a time when Travis came to see him. Travis flew into Chicago where David's office is, and took public transportation to David's office. The last leg of his trip was on bus route 22.
When Travis arrived, he realized he left his suitcase on the bus. A Chicago city bus.
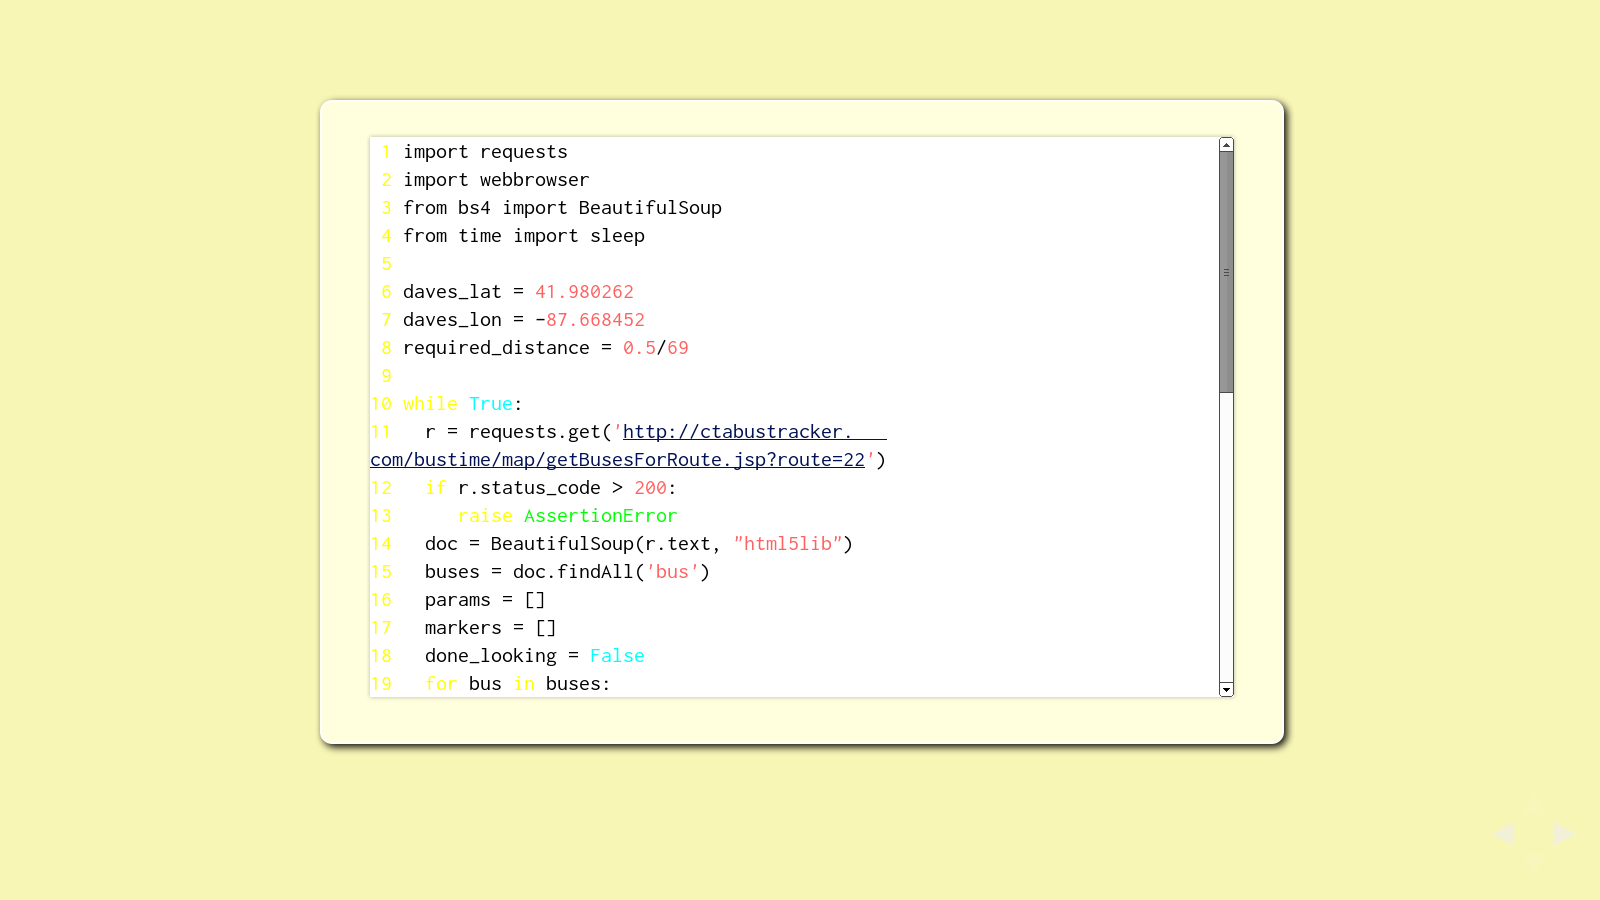
Mere mortals would kiss that bag goodbye, but not David and Travis. They went up to the office and wrote a quick Python program to poll the city data for all of the CTA buses, track the location of all the buses on route 22, and pop open a browser window whenever one of the route 22 buses approached within a half mile of David's office. Then they'd run outside and check for Travis' suitcase.
It took about eight hours til the right bus came by again, but there was his bag. The driver didn't even blink when these two middle-age white guys got on the bus, grabbed a suitcase, and got back off.
This was our first challenge in David's Learn Python tutorial. Write a Python program to find Travis' suitcase. Some of my code is on the slide, along with a sample of the map I generated.
I don't have any great stories like that, which is why you heard David and Travis' story instead of mine. I'm not going to ask you to connect to the CTA website and find a bus. It was a fun program to write, but honestly, it took me as much time to figure it out as we have for this entire presentation. Instead, we're going to use some of the tools that David introduced in his workshop, and a couple of data sets we put together for you, and solve a few challenges that are focus on the data.
First, of course, we need the tools.
If you've already installed IPython and Pandas, please consider making yourself available to other people as they try to work through it.
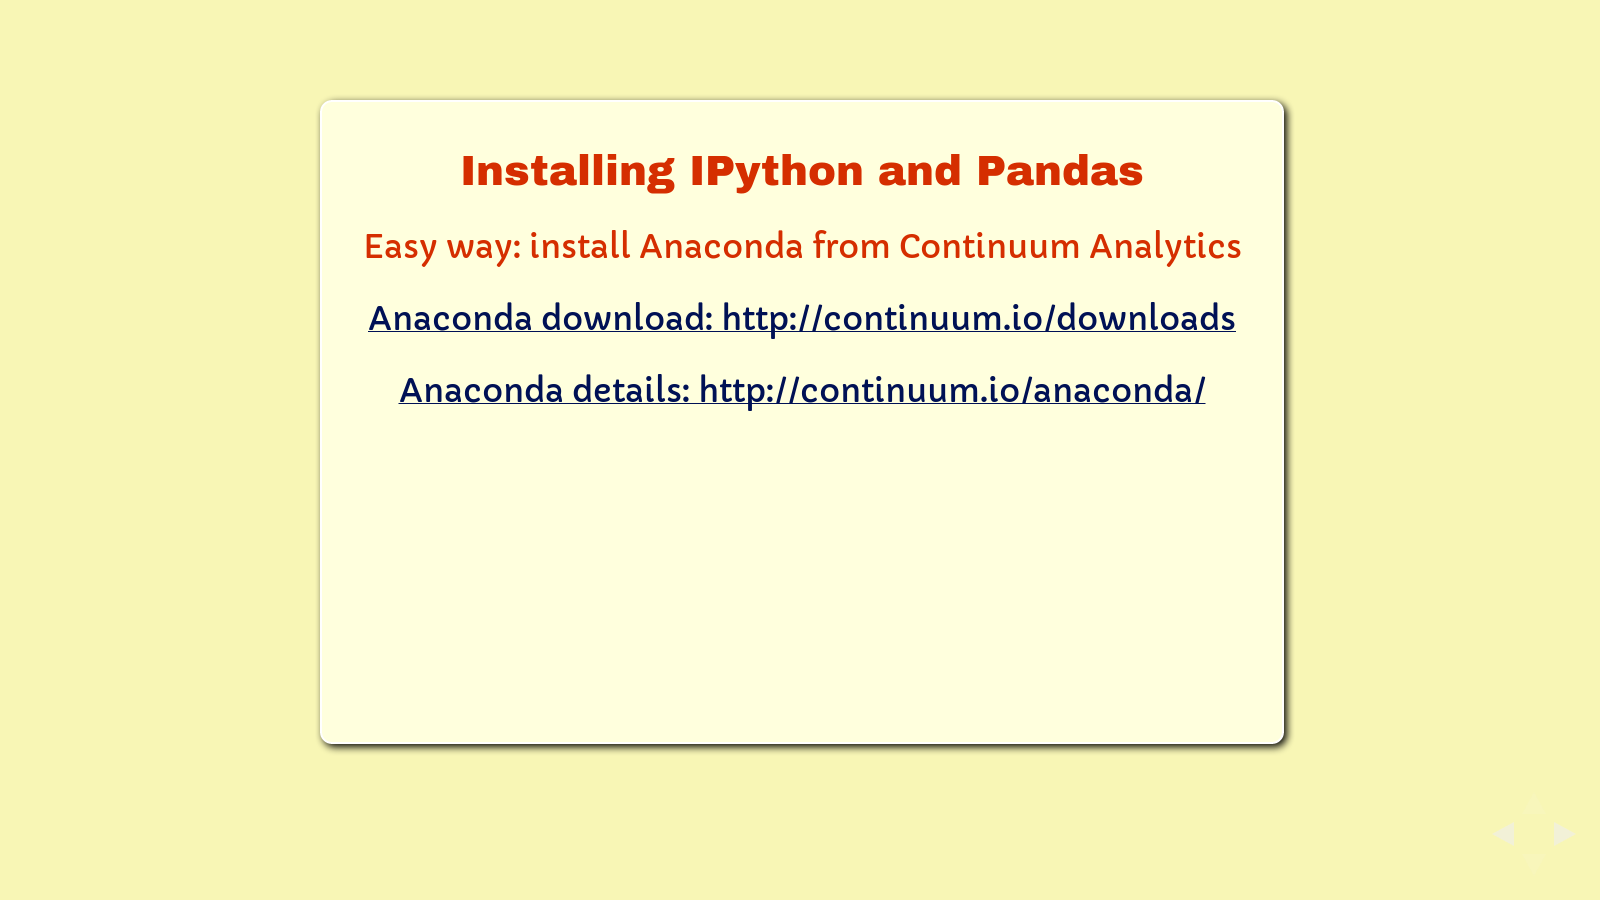
Anaconda is a free-for-all-to-use distribution of Python, IPython, and about 93 other tools from Travis' company, Continuum Analytics, and others. It's not the only way to get IPython and Pandas, but in many ways it's the easiest and most complete set of data analytics tools you can install on a Linux, Mac, or Windows computer. Use the address on the slide for downloading, or there are a couple of USB keys going around that have the various versions available.
If you're using one of the USB keys, also grab the data folder. If you're not, follow the data links and get the downloads.
Once you've downloaded the package, run the installer as directed for your operating system. For Mac and Linux users, it's just a Bash script to install. Windows users double click on the executable.
Let's take ten minutes or so and make sure everyone gets up and running. When you've got it installed and working, you should be able to run the command at the bottom to get IPython running within your default browser.
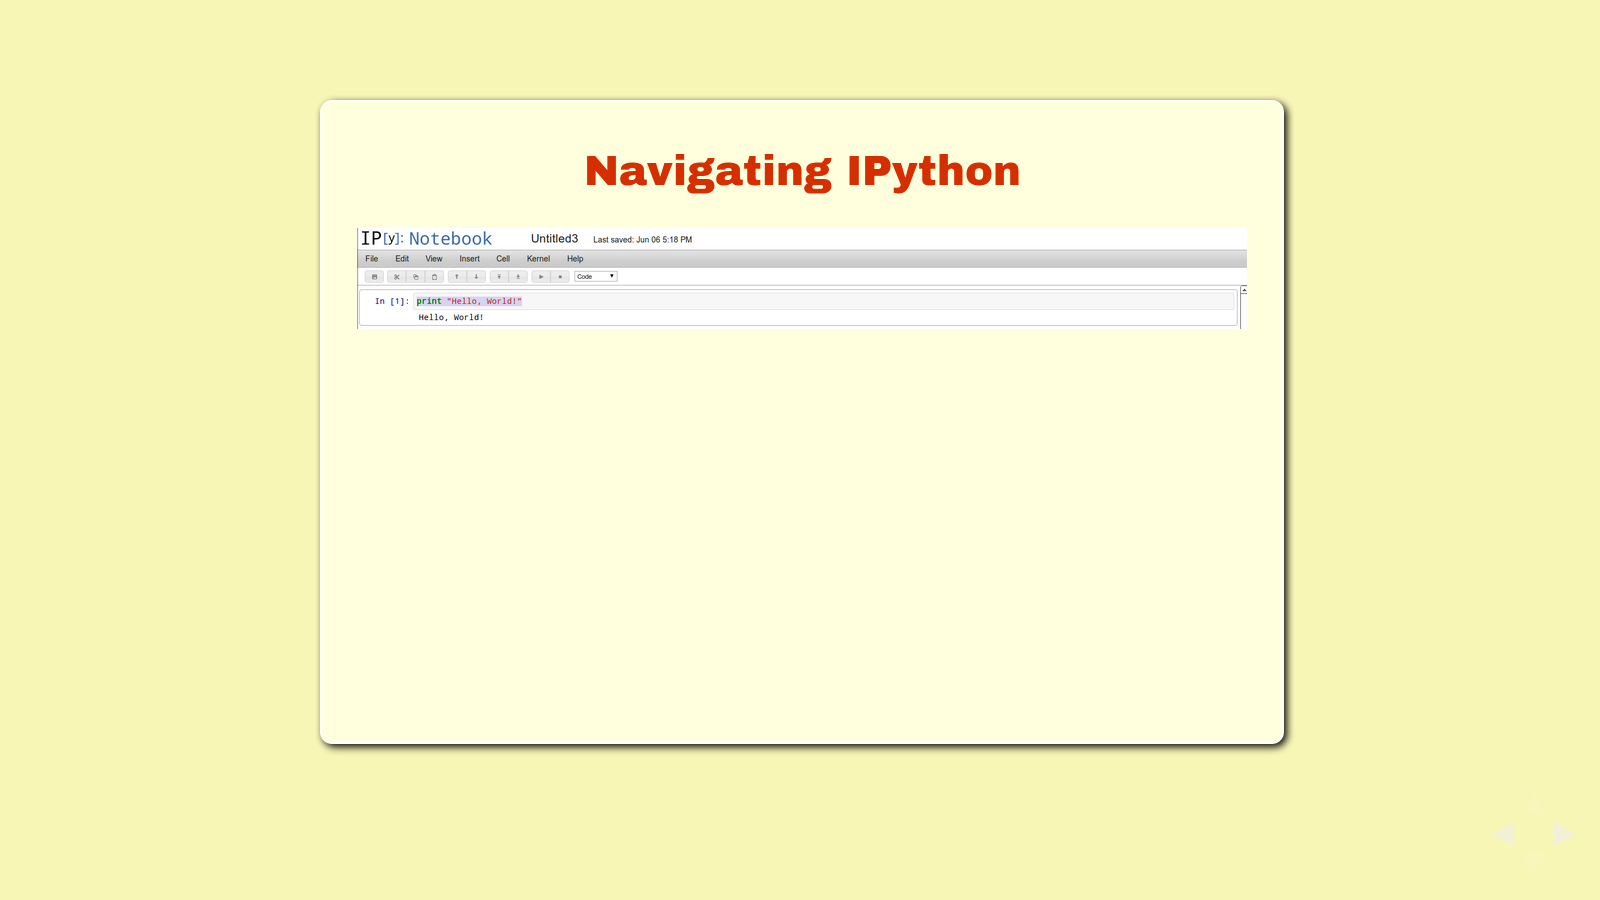
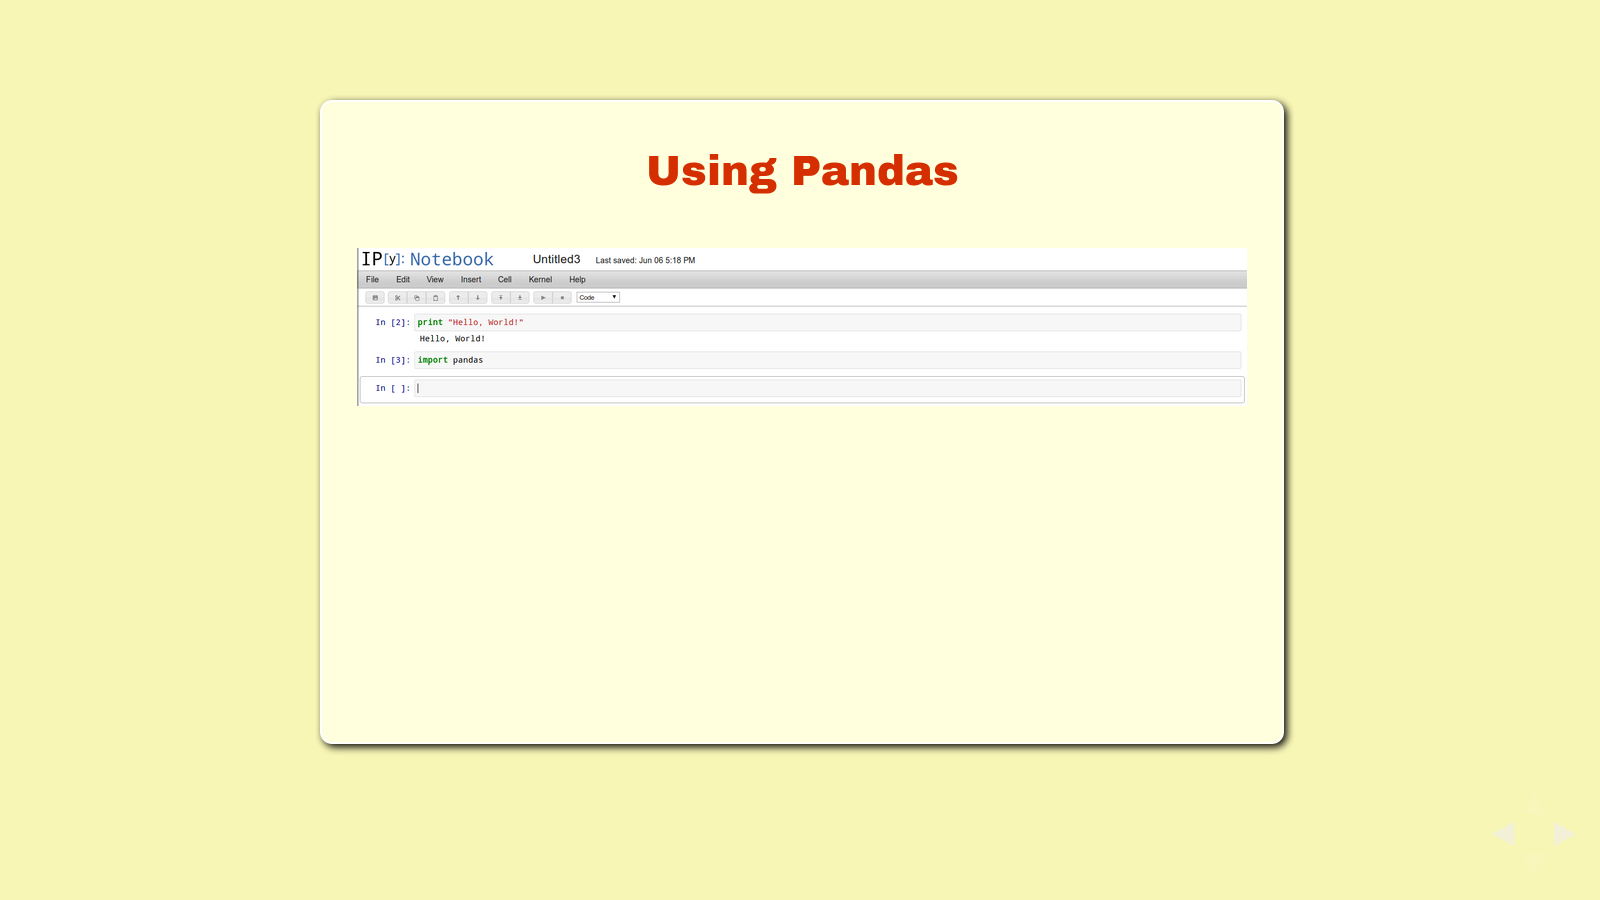
Now that you have IPython Notebook running, let's look around a little bit. Start by clicking the button for a new notebook.
If you've worked with other programming languages, you probably recognize that this is different. IPython is an interactive shell, sometimes called a REPL or "Read-Evaluate-Print-Loop", a program that lets you type in programming statements and see the result. IPython Notebook is a much prettier version that runs in your browser and gives you a bunch of extra tools, like the ability to edit and re-run lines, save your work, refer to previous results, and even make graphics right inside your browser.
Try a simple "Hello World" application, right on the first line. Just type the line on the slide, "print 'Hello, World!'"
If you press Enter, your cursor just moves down on the same line. This is so that you can enter a block of code - more than one line that all execute together.
If you press Shift-Enter, IPython will execute your code and underneath that line, you'll get the string "Hello, World!". That's called "running the cell". Now you'll also have a new line (also called a new cell) to type more code.
Before you type into the second line, click back on the first. This time, instead of pressing Shift-Enter, press Control-Enter. Control-Enter lets you run the line just like Shift-Enter does, but keeps your cursor on the same line. This is convenient if you want to stay on one line of code until you get it right.
You can also see that IPython has drop-down menus and a button bar. The menu lets you do things like save your notebook so you can come back to it later, add new cells inbetween the cells you've already made, and run your notebook from start to finish. The button bar lets you do things like save your notebook, copy and paste, move cells up and down, run your cell, and even change cells to text or headlines so that you can turn your notebook into a document with embedded live code and its output.
Pretty slick, huh.
Okay, that's all the introduction to IPython we're going to do for now. It's that easy. Let's start with Pandas.
Pandas is also easy. First we need to tell Python to use it. That's "import pandas".
- import pandas
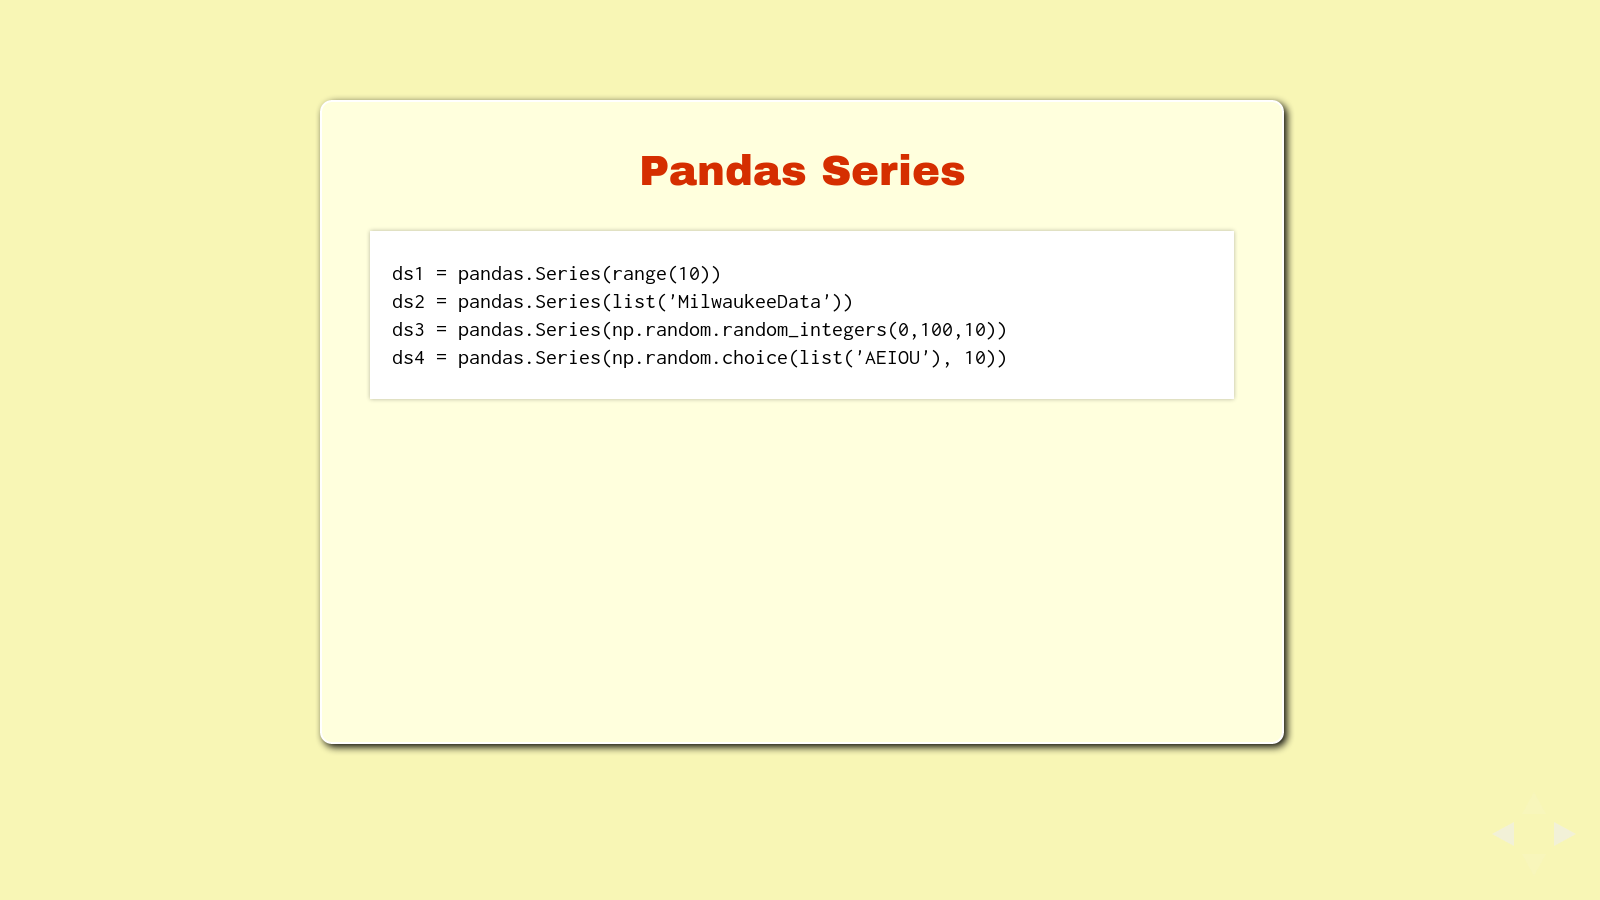
Pandas has two main data types, Series and Data Frames. Series are one-dimensional, just a list with an index. This slide has some examples on how you might create a Pandas Series. Try one or try them all.
ds1 = pandas.Series(range(10))
ds2 = pandas.Series(list('MilwaukeeData'))
ds3 = pandas.Series(np.random.random_integers(0,100,10))
ds4 = pandas.Series(np.random.choice(list('AEIOU'), 10))
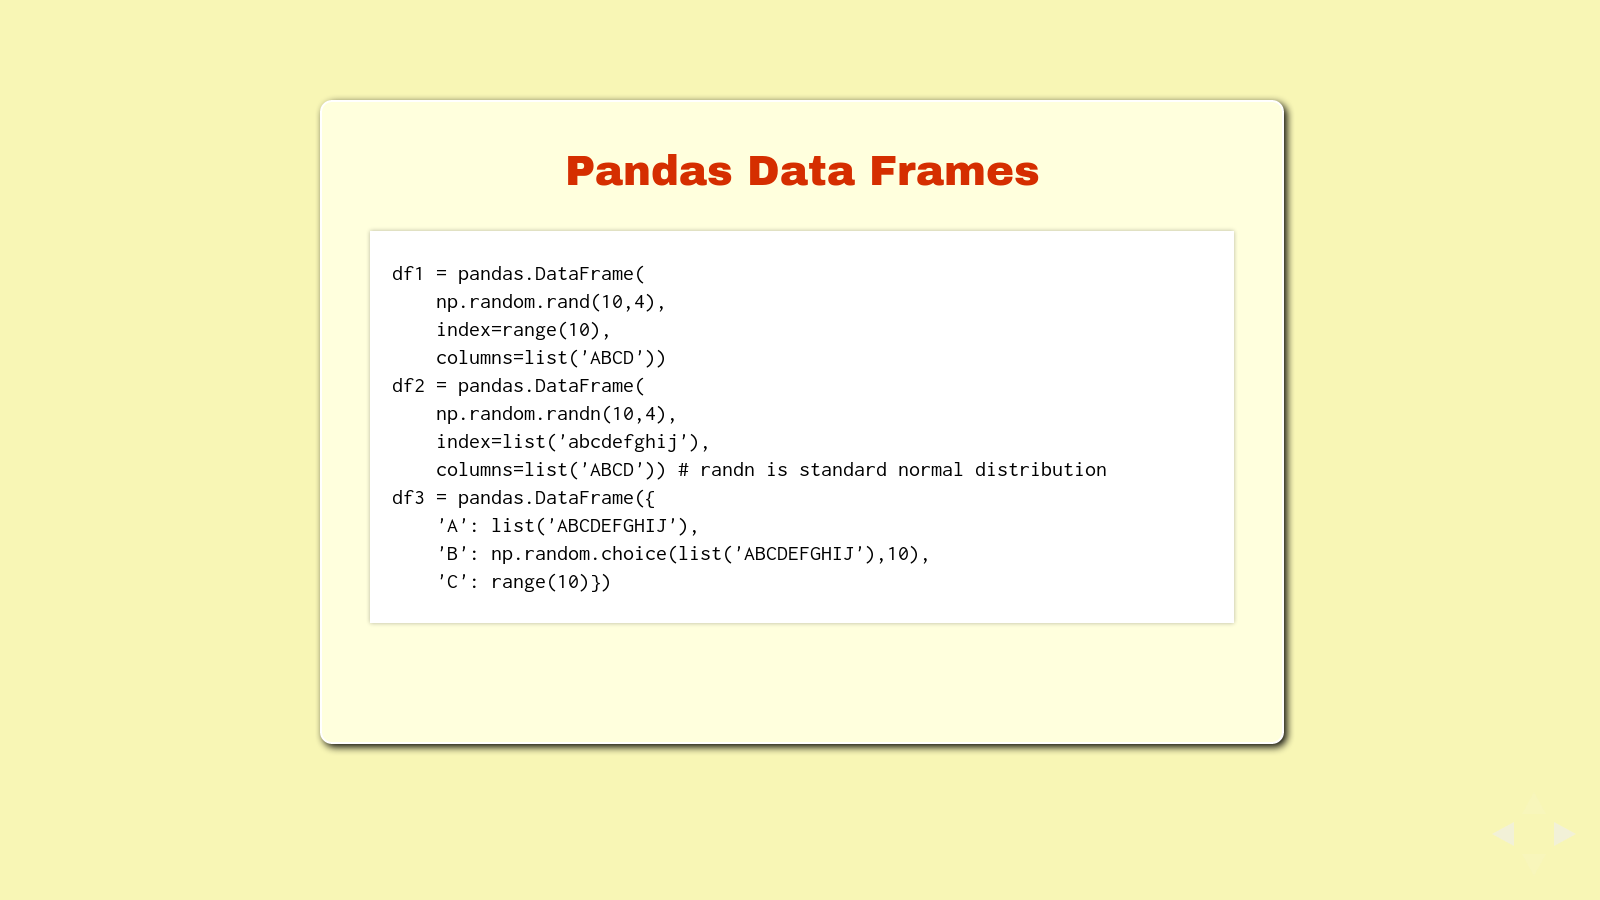
Data frames are two-dimensional, like a matrix or a table. Each column in a data frame is a series, except that they all share the same index. This slide has some examples on how you might create a data frame. Enter all three of these - we'll reference them again.
df1 = pandas.DataFrame(np.random.rand(10,4), index=range(10), columns=list('ABCD'))
df2 = pandas.DataFrame(
    np.random.randn(10,4), index=list('abcdefghij'), columns=list('ABCD'))
df3 = pandas.DataFrame(
    {'A': list('ABCDEFGHIJ'), 'B': np.random.choice(list('ABCDEFGHIJ'),10), 'C': range(10)})
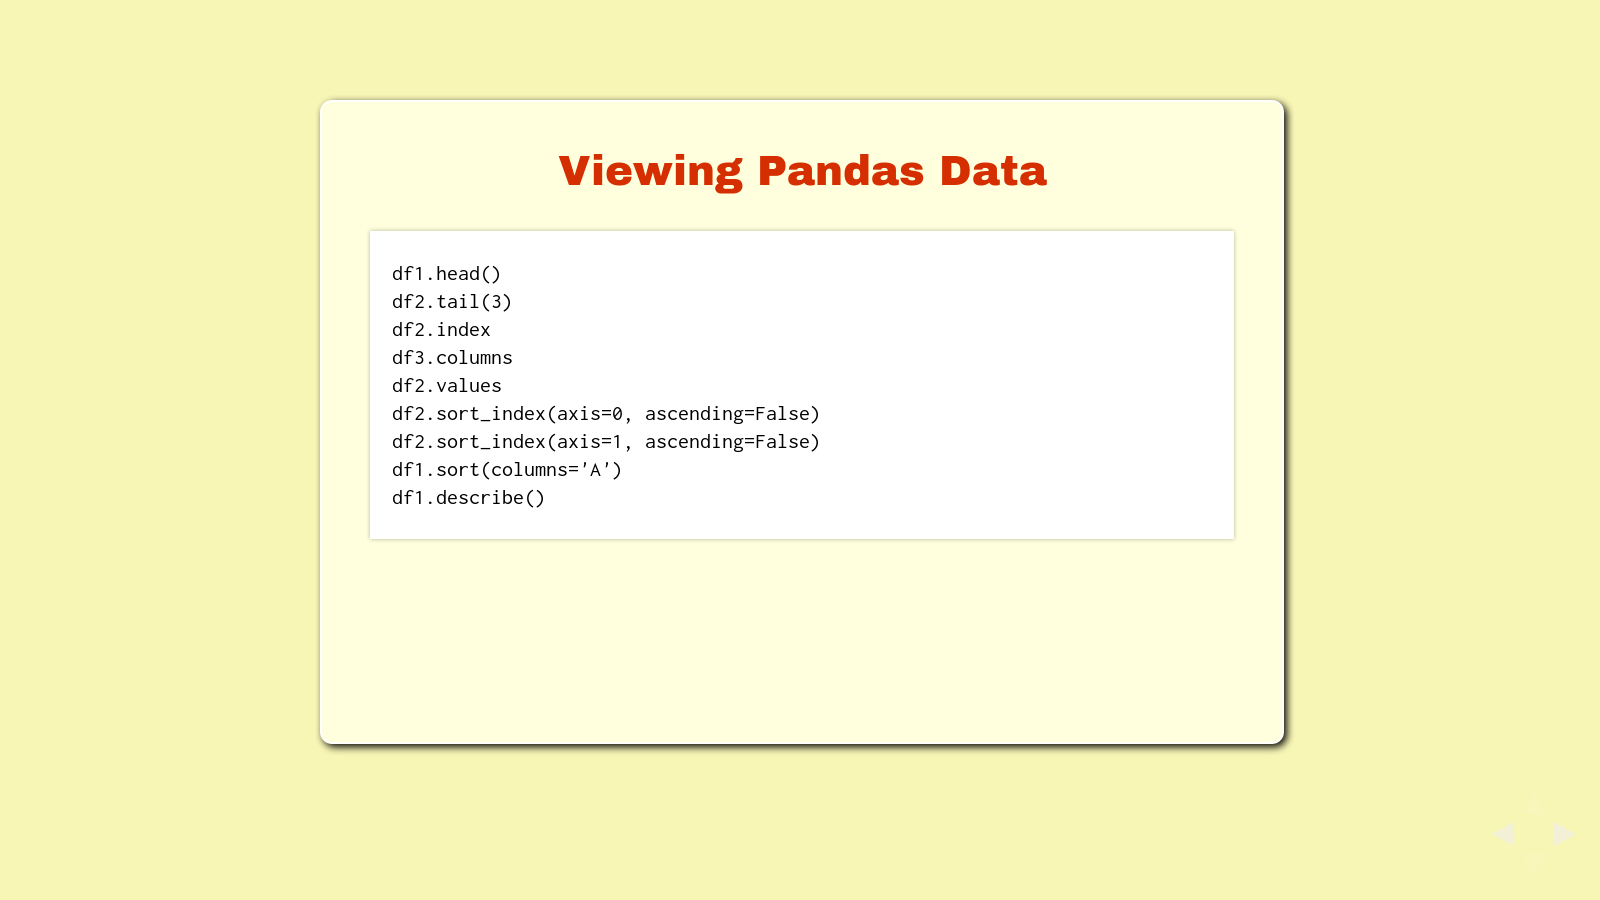
Now that you have a data frame, here are some different ways to look at the data. Try each of them yourself.
df1.head()
df2.tail(3)
df2.index
df3.columns
df2.values
df2.sort_index(axis=0, ascending=False)
df2.sort_index(axis=1, ascending=False)
df1.sort(columns='A')
df1.describe()
I should point out about this point that this is hands on learning. I'm pulling a Zed Shaw, Learning Code The Hard Way on you. I want you to type it all in and learn it with your fingers, not copy and paste. I want you to remember the input, see the output, and make connections in your head. If you're not seeing it, interrupt me and let's talk through it.
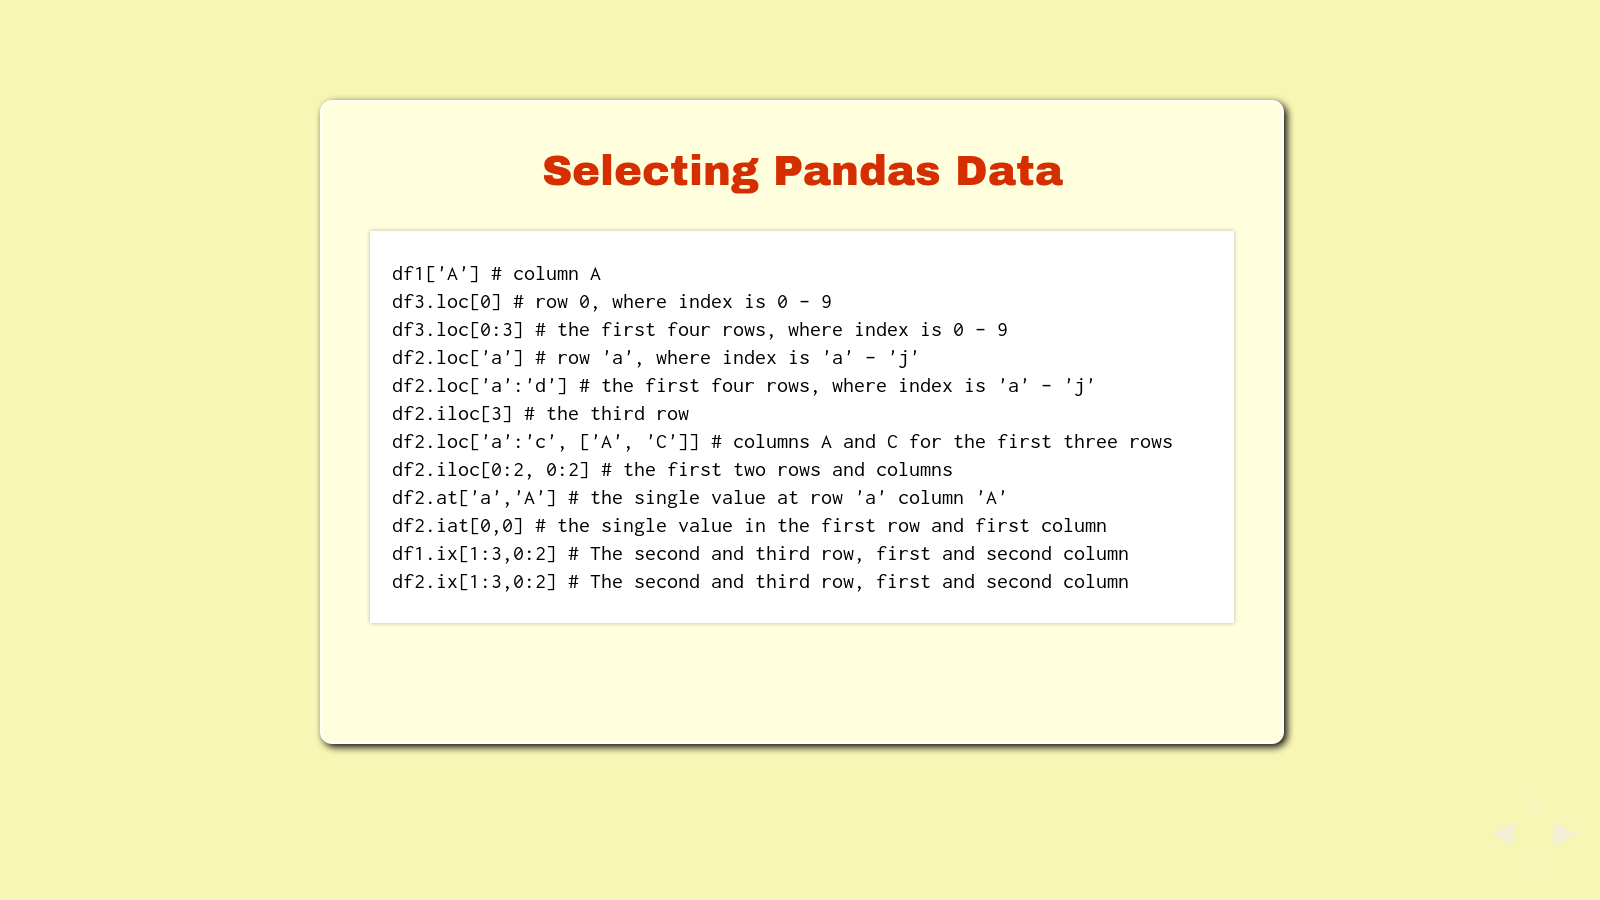
Selecting data from a data frame returns either a series if you select one column, or another data frame if you select a subset of the data frame.
Try each of these selections:
df1['A'] # column A
df3.loc[0] # row 0, where index is 0 - 9
df3.loc[0:3] # the first four rows, where index is 0 - 9
df2.loc['a'] # row 'a', where index is 'a' - 'j'
df2.loc['a':'d'] # the first four rows, where index is 'a' - 'j'
df2.iloc[3] # the third row
df2.loc['a':'c', ['A', 'C']] # columns A and C for the first three rows
df2.iloc[0:2, 0:2] # the first two rows and columns
df2.at['a','A'] # the single value at row 'a' column 'A'
df2.iat[0,0] # the single value in the first row and first column
df1.ix[1:3,0:2] # The second and third row, first and second column
df2.ix[1:3,0:2] # The second and third row, first and second column
loc is location. iloc is integer location, regardless of how the data frame is indexed. ix is cool - it will try what you give it first as labels for the row and column, then as integer locations.
One thing I've learned with Pandas is that there are a number of ways to get to your data. Many of them are wrong and end up looking pretty ugly. It's good to know several ways, so when things get ugly, you can try a different way.
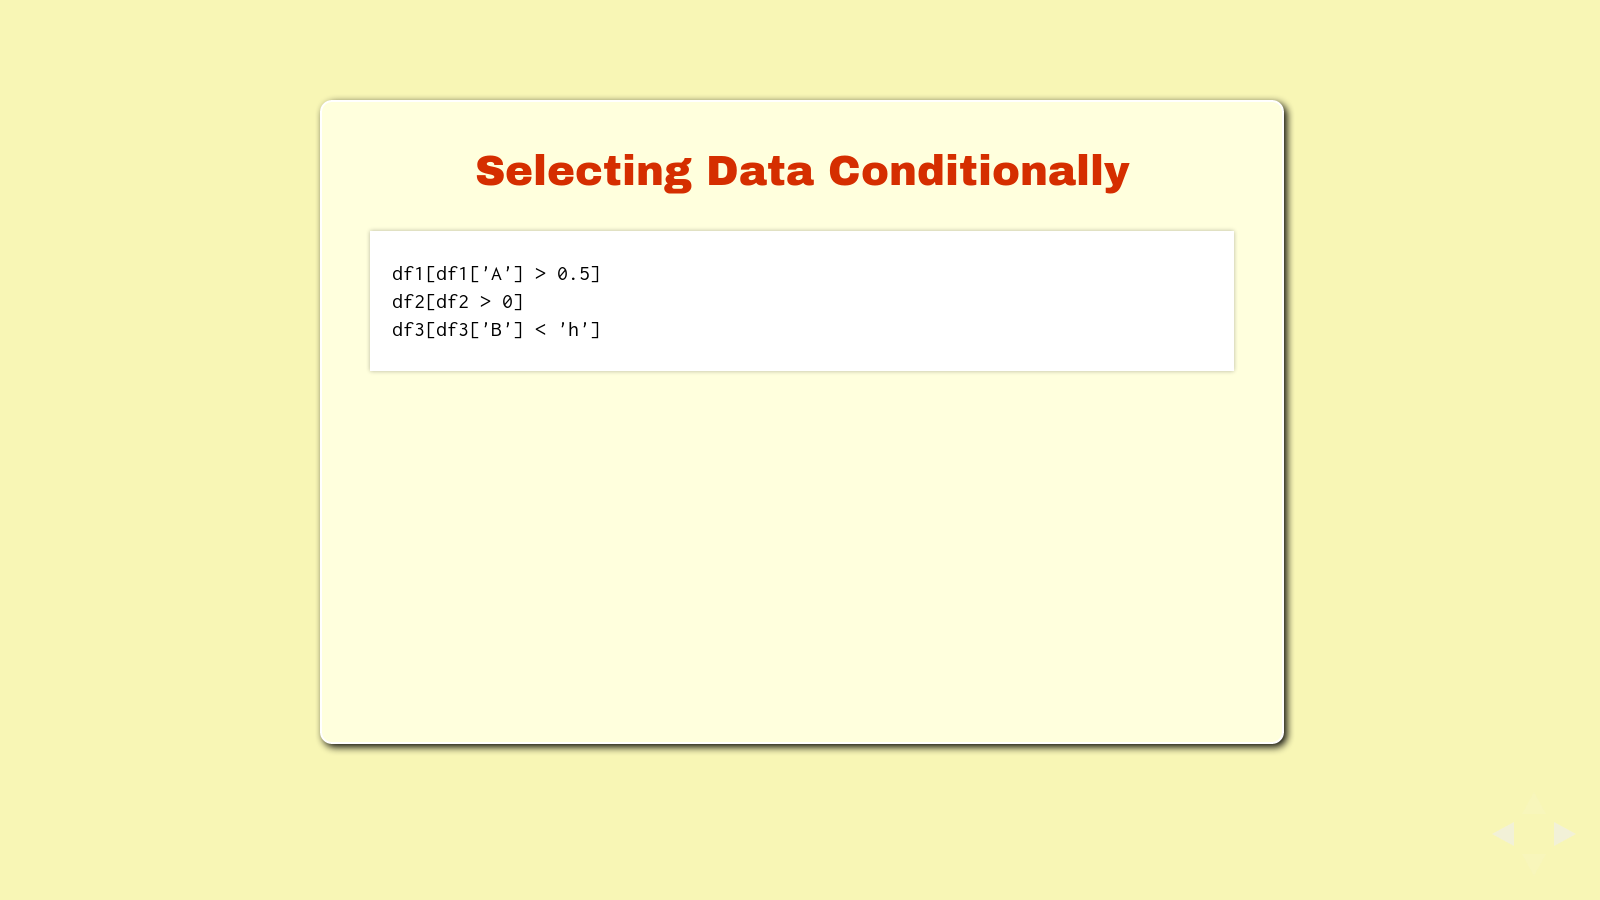
With Pandas, you can also select data conditionally, as in, if the data in a cell meets a certain condition, return it.
Try these selections:
df1[df1['A'] > 0.5]
df2[df2 > 0]
df3[df3['B'] < 'h']
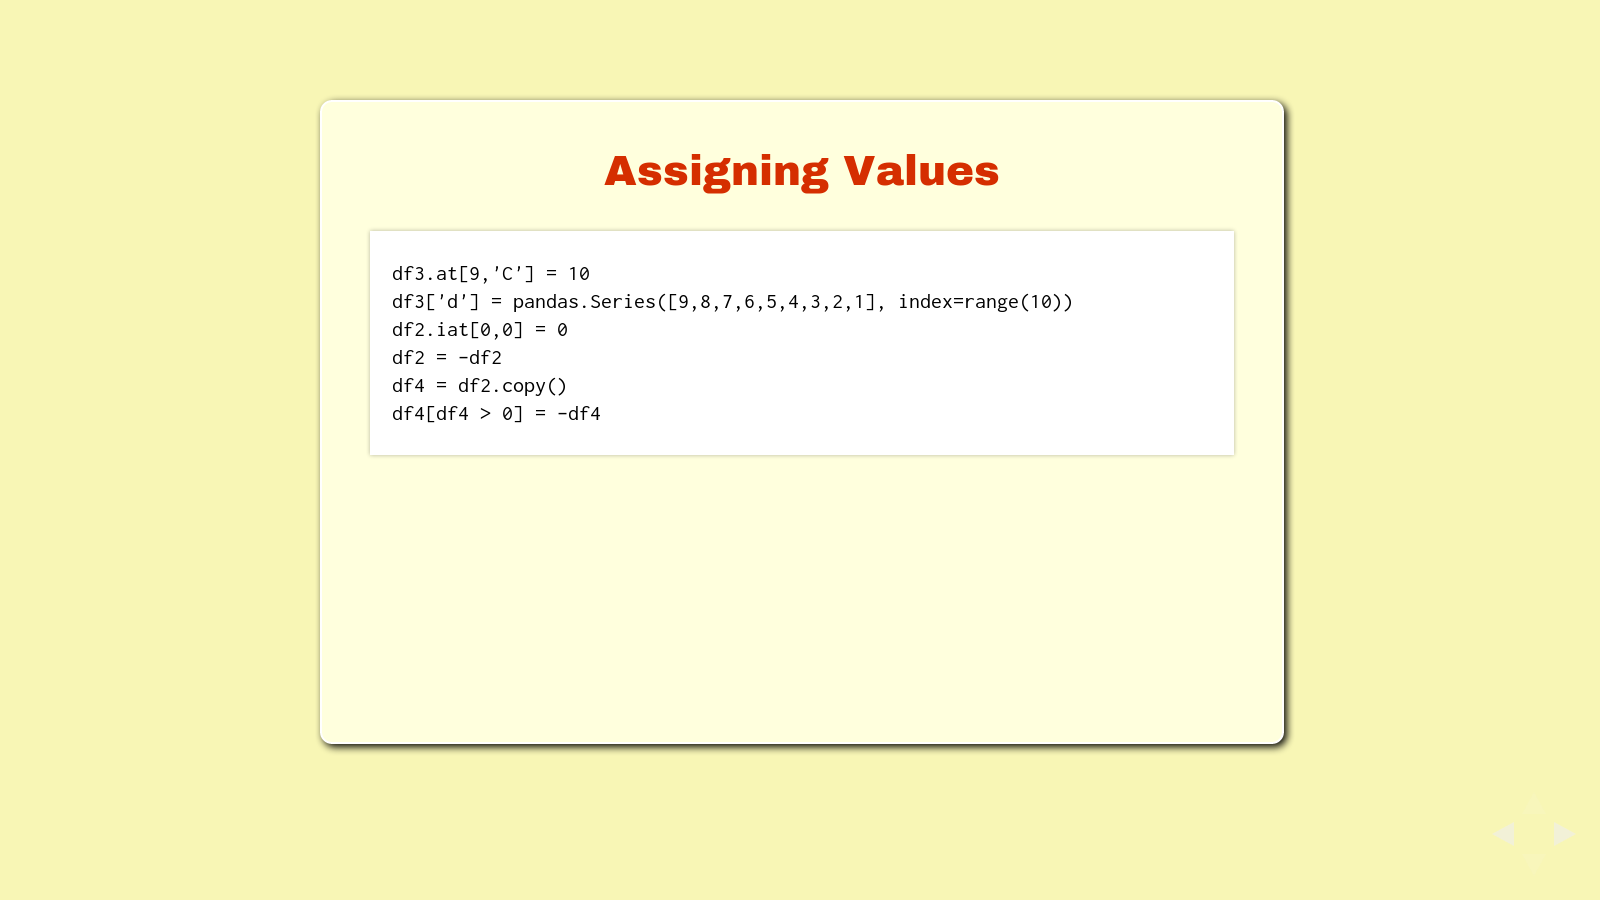
You can use the selection statements to assign values. Try these:
df3.at[9,'C'] = 10
df3['d'] = pandas.Series([9,8,7,6,5,4,3,2,1], index=range(10))
df2.iat[0,0] = 0
df2 = -df2
df4 = df2.copy()
df4[df4 > 0] = -df4
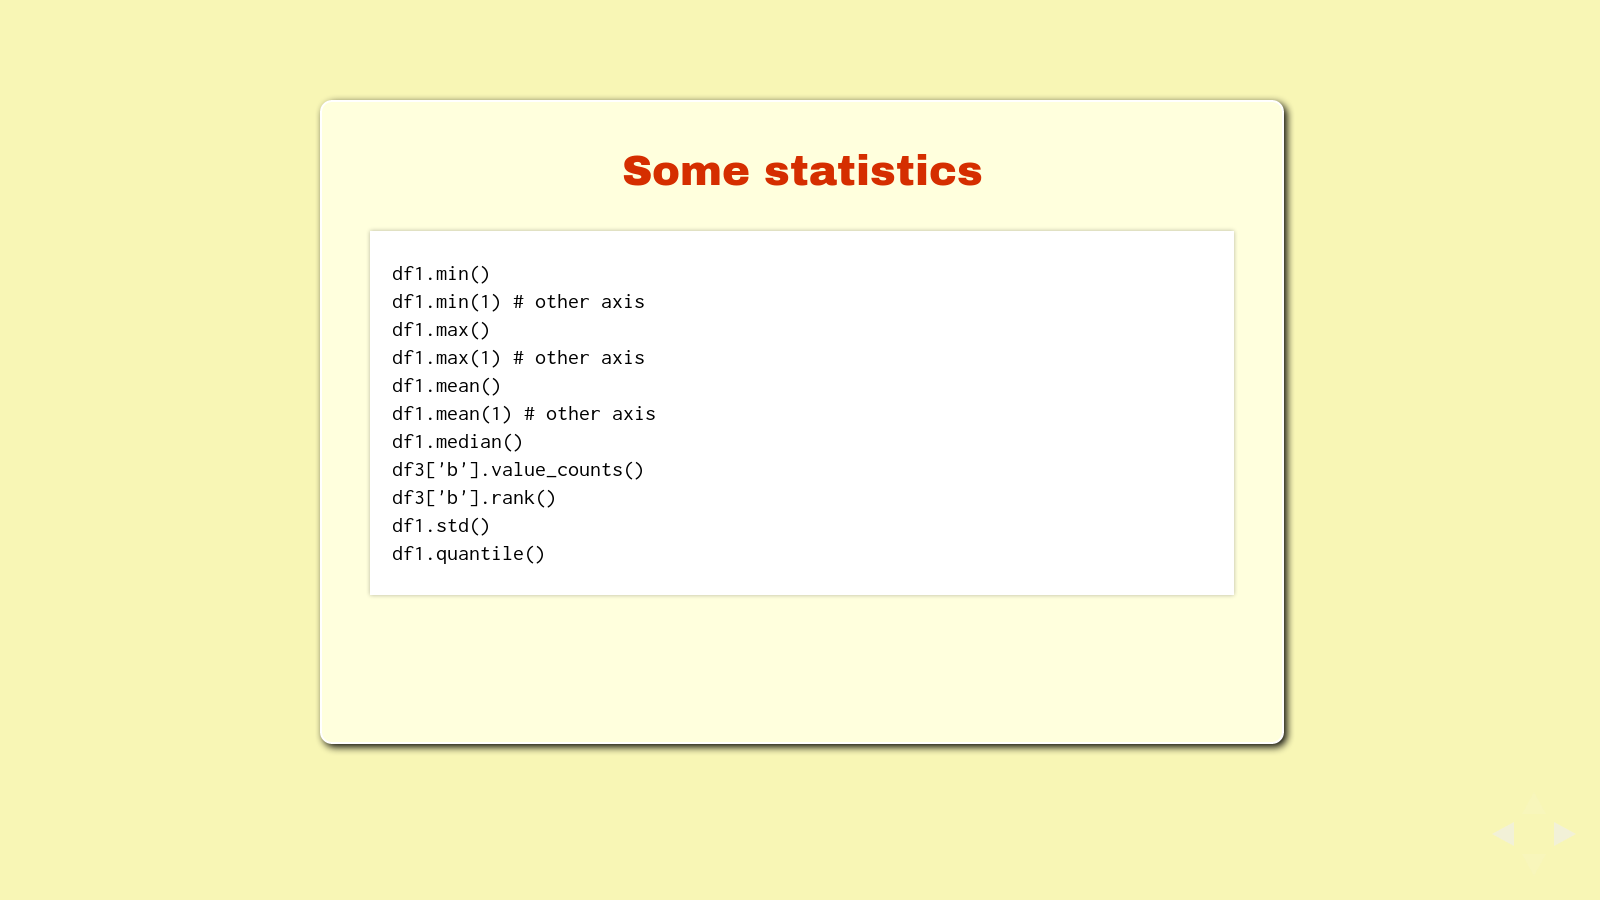
There are of course some statistical tools available. Try some of these.
df1.min()
df1.min(1) # other axis
df1.max()
df1.max(1) # other axis
df1.mean()
df1.mean(1) # other axis
df1.median()
df3['b'].value_counts()
df3['b'].rank()
df1.std()
df1.quantile()
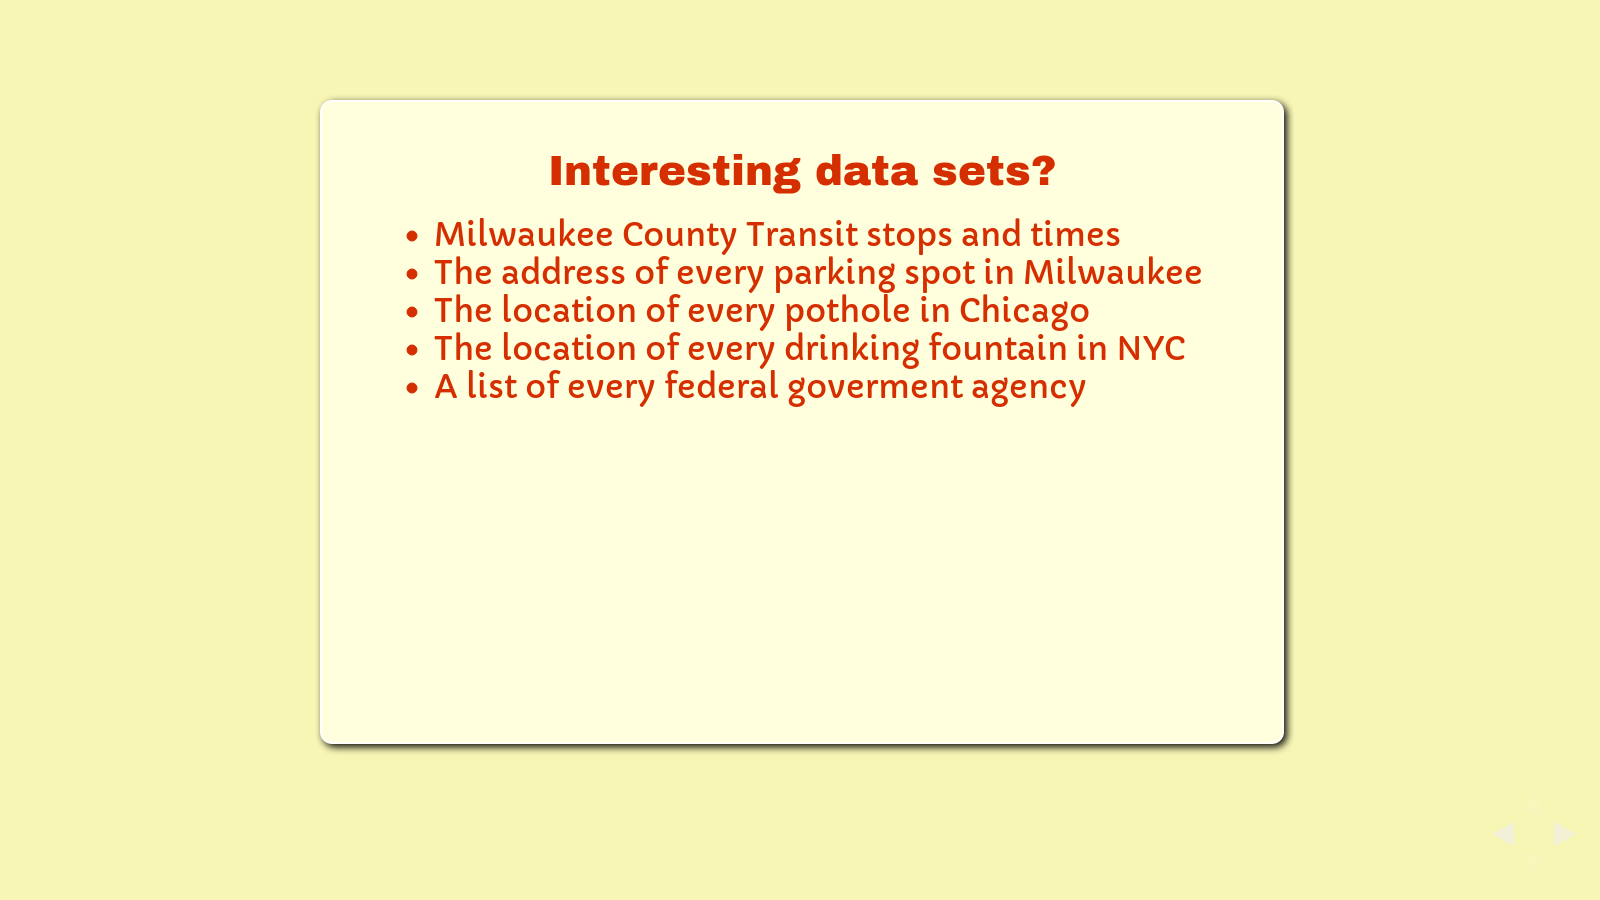
Let's take a break for a moment and talk about interesting data sets before we get into the challenges we have for you. Here's a list of some that I find interesting. What are some others?
- Milwaukee County Transit stops and times
- The address of every parking spot in Milwaukee
- The location of every pothole in Chicago
- The location of every drinking fountain in NYC
- A list of every federal goverment agency
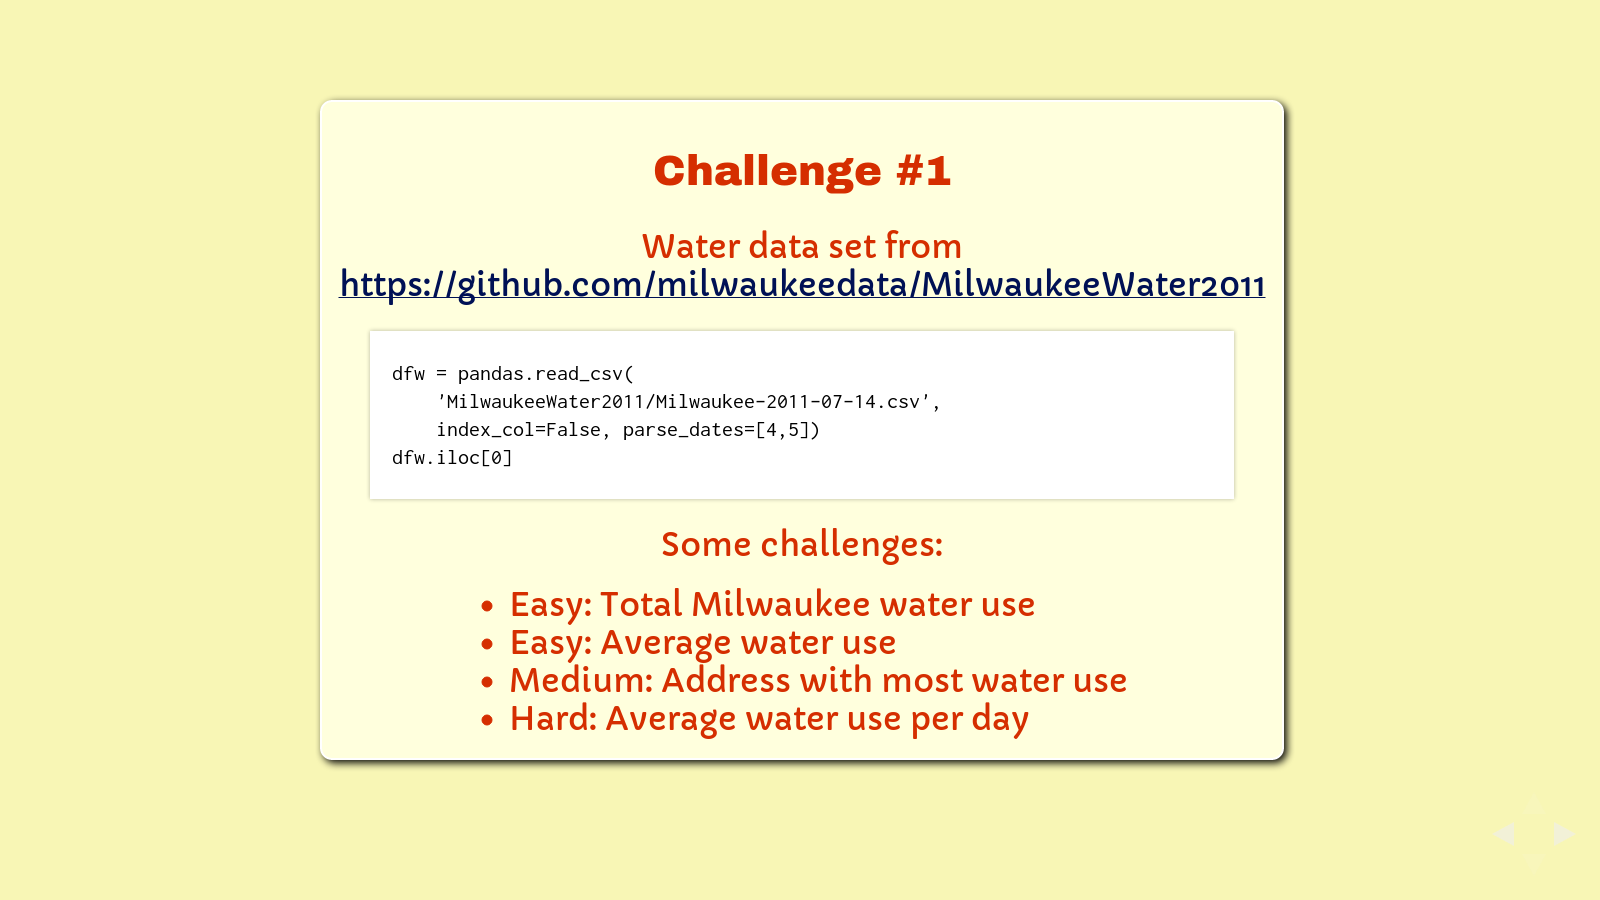
Water data set from https://github.com/milwaukeedata/MilwaukeeWater2011:
dfw = pandas.read_csv('MilwaukeeWater2011/Milwaukee-2011-07-14.csv', index_col=False, parse_dates=[4,5])
dfw.iloc[0]
Some challenges:
- Easy: Total Milwaukee water use
- Easy: Average water use
- Medium: Address with most water use
- Hard: Average water use per day
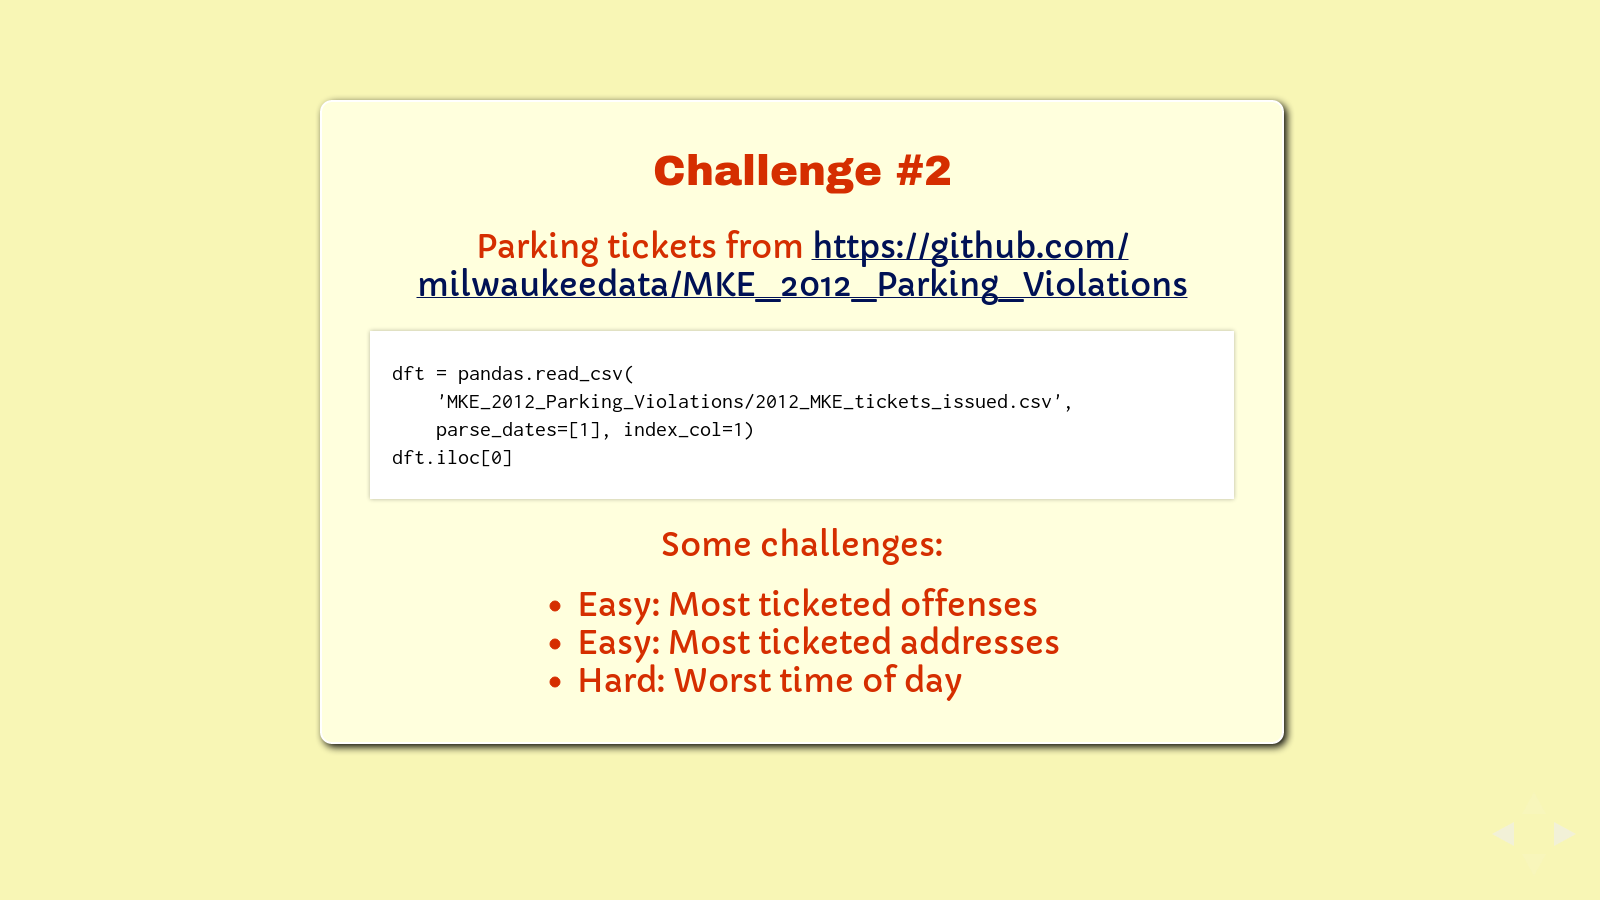
Parking tickets data set from https://github.com/milwaukeedata/MKE_2012_Parking_Violations:
dft = pandas.read_csv(
    'MKE_2012_Parking_Violations/2012_MKE_tickets_issued.csv',
    parse_dates=[1], index_col=1)
dft.iloc[0]
Some challenges:
- Easy: Most ticketed offenses
- Easy: Most ticketed addresses
- Hard: Worst time of day
I'd like to thank you for listening. As always, my presentations come with a 100% money back guarantee plus tech support that is "Free as in beer", which of course means if you buy me a beer, I'll give you tech support.
The International Open Data Hackathon is an annual event inviting citizens in cities around the world to write applications, liberate data, create visualizations, and publish analyses using open and public data to encourage the adoption of open data policies by governments around the world. ↩
The Milwaukee Data Initiative is an advocacy workgroup that works to change the way Milwaukee uses and shares critical data. ↩
PyCon is the largest annual gathering for the community of people using and developing the Python programming language. ↩
Here's the PyCon 2013 tutorial listing for David Beazley's Learn Python through Public Data Hacking. ↩
I used to introduce myself at the RubyMKE and MilwaukeeJS meetups as a Python programmer without a Python meetup. It's true, we had Ruby and Javascript and HTML5 and .Net, but no Python meetup. I attended these other language meetups in order to improve myself as a programmer. Anyway, someone heard me (TJ Kells and his employer, Corvisa) and soon there was a Python meetup too. Actually, soon there was also a Perl meetup, which is actually pretty cool, even if I haven't used much Perl in the last decade. ↩
IPython is an interactive Python shell running in the terminal, in Qt-based windows, and in the browser with support for code, text, mathematical expressions, inline plotting, and other rich media. ↩
Pandas is an open source Python library that provides high-performance, easy-to-use data structures and data analysis tools. ↩